Preflop GTO Charts Explained: How to Actually Read and Use Them
Preflop GTO charts demystified. What the colors mean, why mixed strategies exist, common mistakes players make memorizing them, and how to build your own.
Preflop GTO Charts Explained: How to Actually Read and Use Them
The first preflop chart I ever printed out and pinned to the wall above my desk was wrong, and I didn't know it for almost a year. It was from a free PDF I'd downloaded off some Twitch streamer's website in 2018. It told me to open 22% of hands from UTG at a 9-handed table. I dutifully opened 22% of hands from UTG at a 9-handed table. It took me a long time to realize that the chart was for 100bb stack depths and I was almost always playing deeper, that it didn't account for ante structures at all, and that the player who'd put it together had baked in their own preference for tighter UTG ranges than the actual GTO solution suggested. I lost some money to that chart. Not a lot. But enough that I started looking at preflop charts very differently after.
Preflop GTO charts are everywhere now. There are free ones, paid ones, app-based ones, sites that sell them as packages, coaching products that build whole curricula around them. The vast majority of poker players I've talked to in the last few years either misread the charts they have, use the wrong charts for their stake structure, or memorize charts mechanically without understanding what the colours mean or why mixed strategies exist. This article fixes that. I'll walk through what a preflop GTO chart actually is, what each colour and percentage means, what mixed strategies are doing and why they're not optional, and how to actually use these charts at the table without becoming a robot.
I'm Alex. Nine years online cash, mostly NL200–NL500 6-max, currently using GTO Lab annual for my solver work. I've memorized, derived, and re-memorized preflop ranges enough times that I have strong opinions about how to do this efficiently and how not to.
What a preflop GTO chart actually is
Let's start with what the thing literally represents.
A preflop GTO chart is a visual representation of the equilibrium strategy for a specific preflop decision in a specific game configuration. Game theory optimal here means: the strategy that an opponent cannot exploit if they also play optimally. It's the strategy that, in a two-player zero-sum game, makes you unbeatable in expectation against any counter-strategy.
The chart you're looking at when someone shows you "BTN open at 100bb 6-max with $5 ante" is the output of a solver — a piece of software that ran billions of iterations of CFR (counterfactual regret minimization) until the strategies for both players converged on equilibrium. The chart shows you what the BTN player's strategy is at that equilibrium.
This matters for understanding what the chart is and isn't:
It is: the unbeatable strategy against an opponent also playing the unbeatable strategy.
It is not: the most profitable strategy against any specific opponent.
It is not: the strategy that maximizes your winrate against the average player at your stakes.
It is: a baseline you can deviate from when you have specific information about your opponent.
The chart doesn't know that the player in the BB is a 60% VPIP recreational who never folds preflop. Against that player, your actual best strategy diverges from the GTO strategy in specific predictable ways (you tighten up, you 3-bet for value more aggressively, you don't bluff). The chart is the starting point, not the ending point. If you treat a GTO chart as the universally-correct answer regardless of opponent, you're playing well against the small minority of opponents who are also playing GTO and badly against the majority who aren't.
How to read the colours
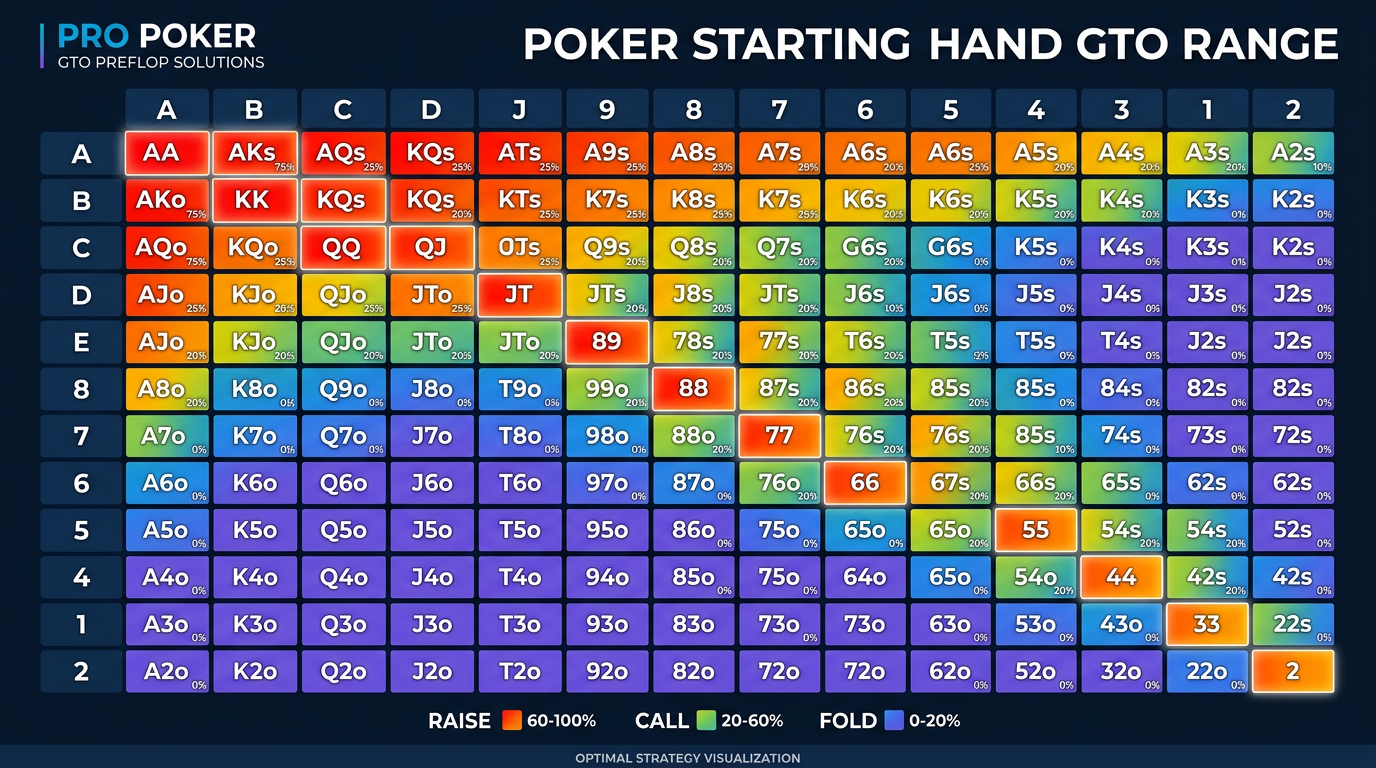
Pick up any modern preflop chart from GTO Wizard, GTO Lab, or PokerSnowie and you'll see a 13x13 grid. Each square represents a starting hand combination. The top-left to bottom-right diagonal is pocket pairs. Above the diagonal is suited hands. Below is offsuit.
The colours on the squares represent actions, and the proportions of colour represent frequencies.
The standard colour mapping (which is consistent across most modern solver UIs):
- Blue or dark blue: Raise (most often: open-raise from a non-blind position, or 3-bet)
- Red or pink: Fold
- Green: Call (or limp, in solutions that allow limps)
- Yellow / orange: Mixed action — see below
- Other gradients: Various sizings of the primary action
A square that's entirely blue means: in 100% of trials, the GTO strategy raises this hand.
A square that's entirely red means: in 100% of trials, the GTO strategy folds this hand.
A square that's split — say 60% blue and 40% red — means the equilibrium strategy raises this hand 60% of the time and folds it 40% of the time. This is what's called a mixed strategy.
The colour intensity in some UI styles also represents the EV of the action. A hand that's a clear value raise will be saturated blue; a hand that's a marginal mixed raise will be a paler blue. Different UI implementations handle this differently — GTO Wizard uses one convention, GTO Lab uses a slightly different one, the older GTO+ uses yet another. Read the legend on whichever tool you're using.
The percentages displayed numerically (when you hover or click on a square) are the frequency for each action. So a square showing "Raise: 60%, Call: 30%, Fold: 10%" tells you the equilibrium mixes those three actions at those rates.
Why mixed strategies exist (and why they're not optional)
This is the conceptual hurdle that trips up new solver users.
When you see a hand that's mixed — say, J9o offsuit from the cutoff, where the chart shows 40% raise and 60% fold — your first reaction is probably "that's stupid, just always do one of them." Pick the more profitable one and always do that. Right?
Wrong. And the why is genuinely interesting.
In a vacuum, if you held J9o in the cutoff and could always make the same decision in isolation, you'd pick whichever single action had higher EV. But poker isn't played in a vacuum. The opponent is constructing their strategy to counter yours. If you always-raise J9o from the cutoff, your overall raising range from that position becomes a specific identifiable distribution. Your opponent can construct a defensive strategy that's optimal against that exact distribution.
If instead you mix — sometimes raise, sometimes fold — your raising range becomes harder to defend against. Mixing is what makes you unexploitable. The 40% / 60% split on J9o isn't because the EV of raising and folding are exactly equal in isolation (they often aren't quite). It's because that specific frequency makes your overall range from that position perfectly balanced.
The implication: in real play, you can't perfectly mix at the table. You can't roll a die for every J9o decision. You'll fall into "always raise" or "always fold" patterns. Both deviations are exploitable. Which deviation is less bad depends on the player pool.
In tougher games (NL500+, against thinking opponents), you want to mix as well as you can, ideally using a randomization device — your hole cards' suits, the second hand on a clock, anything that gives you a quasi-random binary trigger.
In softer games (NL100 and below, against passive recreational opponents who don't track your ranges), the deviation cost is small and you can simplify by always taking the more EV action in mixed spots without losing much.
Understanding this is the difference between a player who reads charts as instructions and a player who reads charts as information.
What changes between charts: the variables that matter
If you've been frustrated trying to memorize "the" preflop GTO chart, this is why: there isn't one. There are many, parameterized by:
Stack depth. A 100bb chart is different from a 200bb chart is different from a 50bb chart. Deeper stacks make speculative hands worth more and tight ranges less protective. Most cash game charts default to 100bb. If you're playing deeper or shorter, you need different charts.
Position. Obvious but worth stating. The UTG chart is much tighter than the BTN chart at the same stake / stack depth. There's a separate chart for every position.
Number of players at the table. A 6-max chart is different from a 9-handed chart. More players means more potential 3-bet and squeeze pressure, which tightens the optimal opening range.
Rake structure. This one surprises people. The amount of rake in the pot affects the EV of marginal hands. A high-rake game (most low-stakes online cash) requires tighter preflop ranges than a low-rake game. The default GTO chart on most solvers is a moderate-rake assumption; if you're playing $0.05/$0.10 with 5% rake capped at $1, you should be playing tighter than the chart suggests.
Ante / straddle structures. Antes and straddles inflate the dead money in the pot, which loosens optimal ranges. A standard 100bb 6-max chart at GG's ante structure is different from a no-ante chart.
Opponent strategy assumption. Some charts (especially older ones) implicitly assume opponents are also playing GTO. Some assume opponents are deviating in specific predictable ways (e.g. opening too tight from the blinds). The chart's source matters.
This is why "the" GTO chart doesn't exist. A serious solver subscription gives you the ability to generate charts for any combination of these variables. If you're using a free chart from a coaching site, find out which variables it assumes and check that they match your game.
How to actually study and memorize charts
Memorizing preflop charts is one of the most boring parts of learning poker, but it pays off enormously because preflop is where you make decisions on every single hand. Here's the process I use and have used to teach to other regs.
Don't try to memorize all positions at once. Start with the BB defending versus an open from each position. This is the highest-frequency decision for most cash players (you defend the BB on more hands than any other single decision). Get this rock-solid before moving on.
Then learn opening ranges from each position. Start with UTG and work toward the BTN. Each position adds a few hands to the range. The mental model "I open this many extra hands per position" is more useful than memorizing 169 squares per position.
Then learn 3-bet ranges versus opens by position. Each combination (you in CO vs UTG open, you on BTN vs MP open, etc.) is its own range. There are a lot of them. Focus on the most frequent (BTN vs CO, blinds vs late position) first.
Use spaced repetition. I use GTO Lab's built-in trainer, but you can use Anki cards or a flash-card app. Spend 15 minutes a day for two months and you'll know the high-frequency ranges cold.
Don't memorize the mixed frequencies precisely. Memorize the action — raise, call, or fold — and treat the mixed cases as "this is a marginal hand, lean toward the more frequent action unless you have a reason." Trying to memorize "raise 32% of the time" exactly is a waste of mental energy and you can't apply it precisely at the table anyway.
Test yourself with hand quizzes. Most modern solver UIs (GTO Wizard, GTO Lab) have a quiz mode. Use it. Aim for 90%+ on the high-frequency spots before moving to the next one.
This process takes months. There's no shortcut. The players I know who skip the memorization step and "just use the chart at the table" tank in real-time decisions because they're spending mental energy parsing charts instead of thinking about opponent reads.
Common mistakes I see
A short list of preflop chart sins.
Using a chart for the wrong stack depth. Default 100bb chart applied to a 50bb tournament situation. The ranges are completely different. Use the right chart.
Memorizing without understanding mixed strategies. A player tells me "the chart says raise this hand" — but the hand is in the 30% raise / 70% fold mixed range, and they're applying it as "always raise" because they didn't notice it was mixed. Their UTG opening range ends up wildly wider than GTO.
Treating GTO as the maximum profit strategy. Beating recreational opponents requires exploiting their specific tendencies, which means deviating from GTO. A player who refuses to deviate "because the solver said" leaves money on the table.
Ignoring rake. GTO charts published online usually assume moderate rake. Low-stakes online cash has higher effective rake. Tighten up.
Buying expensive chart packages. A coaching site sells "the complete GTO chart bundle" for $300. The same charts are available in any solver subscription for one month's cost. Just subscribe to a solver.
Not building positional 3-bet ranges. Players memorize opening ranges and then have no idea what to 3-bet from each position vs each opener. The 3-bet ranges are arguably more important than opening ranges for winrate. Spend the time.
How to build your own custom charts
Once you can use existing charts, the next level is generating your own for your specific game.
In GTO Lab, you can build a preflop tree by specifying:
- Number of players (typically 6 for 6-max cash)
- Stack depths (typically 100bb for cash, varies for tournaments)
- Ante / straddle structure
- Allowed bet sizings for each player
- Rake structure (percentage, cap, jackpot drops)
Run the solve, and within minutes you have a custom chart for your exact game configuration. This is how serious players build charts that account for their actual rake structure and stack depths rather than relying on generic charts.
The process in GTO Lab specifically: New Solve → Preflop → Configure tree → Solve → Browse results. The same workflow exists in GTO Wizard with slight UI differences.
For most players this is overkill. Generic 100bb charts are close enough to your actual game that the difference doesn't matter. But for serious mid-stakes players, building a custom chart for your specific rake structure can yield small but measurable winrate improvements.
A practical "what to do at the table" guide
How do you use all this when you're actually at the table with three seconds to make a decision?
Default to the chart, deviate based on reads. Your baseline strategy should be the GTO chart for your game. When you have a specific read on a player, deviate from the chart toward the exploitative play. With no read, play the chart.
Memorize the high-frequency spots cold. Opening ranges from each position. BB defends versus opens. SB versus BTN open. These come up constantly. Don't be parsing charts for these.
For mixed-frequency hands at the table: lean toward the more frequent action. If a hand is 60% raise / 40% fold, raise unless you have a reason not to. Don't try to mix at the table; you can't, and the deviation cost from "always more frequent action" is small.
For low-frequency spots, accept that you'll make mistakes. The 4-bet bluff range from the SB versus a BTN open against a CO 3-bet is not something you'll get right at the table. It's fine. These spots come up rarely. Focus your study on the spots that come up often.
Review one preflop spot per session post-game. Pick a spot that came up that you weren't sure about, look up the GTO solution, compare to what you did. This is the most efficient way to gradually improve your preflop play over time.
What good preflop study looks like over six months
To put it all together, here's what a six-month preflop study plan looks like for someone serious about getting their preflop right.
Month 1: Memorize opening ranges from each position at 100bb 6-max. 15 minutes a day in your solver's quiz mode. Goal: 90% accuracy on opening ranges by end of month.
Month 2: Memorize BB defending ranges versus each opening position. Same daily routine. Goal: 90% accuracy on BB defenses.
Month 3: Memorize SB defending ranges (call vs 3-bet) versus each opening position. Goal: 90% accuracy.
Month 4: Memorize 3-bet ranges by position (you in CO vs UTG, BTN vs CO, etc.). Goal: 80% accuracy on the high-frequency 3-bet spots.
Month 5: Memorize 4-bet ranges and squeeze ranges. Lower frequency spots, 70% accuracy is fine.
Month 6: Custom chart construction for your specific game (rake, stakes, ante structure). Use solver to generate, compare to default charts, internalize the differences.
After six months of this, you'll have preflop ranges that are tighter than 95% of players at your stakes. Your postflop game probably won't have improved much in those six months. That's fine. Preflop is the foundation. Get it right, and the postflop spots become much more navigable because you're playing simpler ranges.
The honest verdict on preflop charts
Preflop GTO charts are tools. They're not a magic spell that wins poker for you. A chart that you've memorized and don't understand will help you win against worse players and lose against better ones. A chart that you've memorized AND understand — meaning you know what mixed strategies are doing, you know which variables your chart assumes, and you can deviate intelligently against specific opponents — is one of the most valuable assets in your poker game.
If you want a single sentence: get a GTO Lab or GTO Wizard subscription so you have access to charts for your exact game configuration, spend three months memorizing the high-frequency spots, learn what mixed strategies mean and why they exist, and then use the charts as a baseline you deviate from based on opponent reads. That's the whole answer. Everything else is detail. The detail matters, but the order does too — fundamentals first, deviations second, never the reverse.
A worked example: BB defense versus a CO open
Let me walk through one specific spot in the level of detail that should make the abstract stuff above concrete. The spot: I'm in the BB at NL200 6-max, 100bb effective, standard rake. CO opens to 2.5bb. The action is on me. What does the chart say and what does it mean?
The defending range from the BB versus a 2.5bb CO open at this configuration includes roughly 62% of starting hands. That's a wide range. It includes obvious stuff (all pairs, all suited broadways, all suited connectors down to about 54s) and a long tail of marginal hands (J6s, T7s, K5s, etc.) that get flat-called.
The 3-bet range overlapping inside that 62% is roughly 12% — including value combos (TT+, AJs+, KQs, AQo+) and the "linear bluff" hands that are the next tier down (A5s-A2s for blockers, suited gappers like J9s-T8s).
So now decode what the colour mix on a hand like 76s tells you: probably mostly green (call), with some blue (3-bet) and zero red (fold). The mix might be 80% call, 20% 3-bet. What is that telling you?
It's telling you that 76s has enough equity and playability versus CO's range to defend always — never folding it from the BB at this price is the equilibrium answer. The 20% 3-bet frequency is balancing your bluff range so CO can't profitably 4-bet light against your 3-bets. If you only ever 3-bet for value (TT+, AJs+) you'd be exploitable; the 76s mix adds bluff combos in a hand that retains some equity if called.
Now contrast with K6o. The chart probably shows mostly red (fold), some green (call), zero blue (3-bet). Maybe 60% fold, 40% call. K6o has worse equity than 76s versus CO's range despite "looking" stronger. The hand has reverse implied odds (you can hit the king and lose to AK, KJ) and limited postflop playability.
The takeaway for any single hand colour distribution: the colours encode equity, playability, blocker properties, and balance considerations all at once. Reading the chart is reading all of those simultaneously.
When you're memorizing this range, you're not just memorizing "76s is a defend." You're internalizing why. After enough exposure, you start to see the pattern — suited connectors are call-heavy with small mixed 3-bet, offsuit broadways and high cards are call-heavy without 3-bet, suited aces are mixed call/3-bet, low offsuit cards are fold. That mental compression makes the chart memorable. Pure brute-force memorization of 169 squares per spot is impossible; pattern memorization is achievable.
How charts change at different stack depths
The 100bb chart that everyone defaults to is one snapshot. Real cash games span 50bb (a sit-down at a soft live game with auto top-up disabled) to 250bb+ (deep online cash, certain live rooms, pot-limit games). Tournament play covers 15bb-100bb depending on stage. The optimal preflop strategy genuinely changes across this range.
At 50bb effective: opening ranges tighten because postflop maneuverability is reduced. You can't c-bet, double barrel, river bluff with the same range when the SPR is small. Marginal hands lose value. The BB defense range tightens because shorter stacks make it harder to realize equity. 3-bets become more polarized — value range stays similar, bluff range either shifts to all-in 3-bet shoves or disappears.
At 100bb effective: the standard charts. Most cash games default here.
At 150bb effective: opening ranges loosen marginally for suited speculative hands (suited connectors, suited gappers) because their implied odds increase. 3-bet sizes grow slightly (from 3x to 3.5x or so). The BB call range expands slightly. 4-bet ranges include more flatting of 3-bets because you can play postflop with deeper SPR.
At 250bb effective: the changes from 150bb continue. Suited gappers and small pairs become more attractive because the implied odds payoff if you flop a set or stack is huge. Linear bluff 3-bets decrease because deep stacks make 4-bets and squeezes scarier. Many spots become "small bet, see flop" rather than aggressive preflop action.
If you play primarily 100bb cash, memorize 100bb charts and don't worry about the deeper stuff. If you regularly play deep (some live rooms, some online cash sites with no cap), get a chart for your actual depth. Generic 100bb ranges applied at 250bb will leave money on the table.
Tournament charts versus cash charts
A note for players who play both formats. Tournament charts are wildly different from cash charts.
The major differences:
Antes: most tournament structures have antes once you're past the early levels. Antes inflate the dead money and loosen optimal opening ranges by 3-5% per position.
ICM (Independent Chip Model): tournament chip values aren't linear. Stacking off for a marginal +EV decision can be -EV in ICM terms because losing your stack costs you more than doubling it gains you. This tightens calling ranges versus all-ins, especially at final tables and bubbles.
Stack depth volatility: in tournaments your stack is constantly changing, often dramatically. You'll play 15bb spots, 30bb spots, 60bb spots, 100bb spots all in the same tournament. Each is a different chart.
Push/fold spots: under about 15bb effective, the optimal strategy collapses to push/fold for many positions. There are dedicated charts (Nash equilibrium tables) for this.
If you're a cash player who occasionally plays tournaments, don't try to use your cash charts. Get tournament-specific charts (GTO Wizard's tournament library is extensive; GTO Lab can generate them) and study them separately.
Building intuition for "why" — three core principles
If you want to internalize charts faster, learn the three principles that drive most of the chart structure. Understanding these means you can sometimes derive the right action without consulting the chart, which speeds up table play.
Principle 1: positional power. The later your position, the more hands you can profitably play. The BTN can open ~50% of hands; UTG can open ~15% at 6-max. The reason is information — acting last gives you the right to react to opponent action rather than commit before knowing what they'll do. Charts encode this in the obvious way: opening ranges expand as you move from UTG toward BTN.
Principle 2: pot odds and price. When facing an open, your defending range from the BB depends on the price you're getting (how much to call relative to pot size). At a 2.5x open with 1bb already posted, you call 1.5bb to win 4bb — getting 2.67:1, which means you need 27% equity. Almost any two cards have 27% equity versus a wide opening range, which is why BB defending ranges are huge. SB defending ranges are tighter because you're out of position postflop.
Principle 3: balance and unexploitability. Mixed strategies and ranges are constructed to be unexploitable. If you only 3-bet your strongest value hands, opponents can fold all marginal hands to your 3-bets and only continue with hands that beat your range. Adding bluff combos to your 3-bet range (the linear bluffs in the 76s and A2s tier) forces opponents to defend wider, which gives your value hands more action. The chart's bluff frequencies aren't arbitrary — they're calibrated to make your value bets profitable.
Once these three principles are internalized, you can guess the chart for unfamiliar spots with reasonable accuracy. That guess won't be perfect but it'll be close enough that you can compare your guess to the actual chart and see where your intuition is off — which is the fastest way to refine your understanding.
Common questions about chart usage
A few things people ask repeatedly when learning to use charts.
Should I have the chart open while playing? Different schools of thought. My answer: no, because the act of looking at a chart breaks your timing tells and slows your tables to where you can't multi-table effectively. Use charts off-table for study; rely on memorized ranges at the table. If you don't trust your memorized ranges, study more before adding more tables.
What if my opponent obviously isn't playing GTO? Deviate. The chart is the baseline assumption. If villain is folding to every 3-bet, 3-bet wider. If villain never folds preflop, tighten your value 3-bets and stop bluff 3-betting. The chart tells you what to do against an unknown player; reads tell you how to deviate.
Are mixed strategies actually worth caring about at low stakes? Marginally. Most opponents at NL10-NL50 don't track your ranges with enough fidelity to exploit imbalances. You can play "always raise" or "always fold" on mixed spots and lose maybe 0.5bb/100. At higher stakes the deviation cost grows because opponents are paying attention.
Do I need to memorize 4-bet ranges? Yes if you're playing NL100+, especially in 6-max where 3-bet pots are common. The 4-bet decision (after villain 3-bets your open) comes up frequently and getting it wrong is expensive. The 4-bet range is smaller than the 3-bet range so memorization is more tractable.
Should I use different charts for online vs live? If you're playing the same stake and same effective depth, no. The game theory doesn't care if it's online or live. Player tendencies obviously differ — live opponents are generally weaker — but the GTO baseline is the same. Where you'll deviate from the baseline differs.
A final word on chart obsession
The biggest trap with preflop charts is becoming so focused on getting them perfect that you neglect the rest of your game. I've watched players spend six months memorizing every preflop range to perfection and still lose at NL50 because their postflop play is undeveloped. Preflop is foundational but it's not where most of the money is at most stakes.
A reasonable mental allocation for serious players: roughly 30% of study time on preflop (especially in the first 6-12 months of serious study), 50% on postflop (cbets, turn play, river decisions, range construction), 20% on opponent-specific deviations and exploitation. If you're spending 80% of your study time on preflop charts, you're over-rotating.
Get the high-frequency preflop spots solid. Don't chase perfection on the low-frequency ones. Move on to postflop study. Come back to preflop periodically to refresh the spots you've forgotten. The preflop game is a foundation, not the whole house.